Advantage Group Logo
  • Our Expertise
    • Strengthening Supplier Partnerships
    • Improving Retailer Relations
    • Increasing Distributor Engagement
    • Boosting Employee Engagement
    • Supporting Sales Teams
  • Engagement Solutions
    • Advantage Report
      • How it Works
      • Actioning Feedback
      • Program Benefits
      • Advantage Analytics
      • Refined Framework
    • Advantage Custom Solutions
      • Solutions Benefits
      • Feedback Needs
    • Advisory Services
  • Client Testimonials
  • Insights
  • About Us
    • People
    • Careers
    • Media
  • Blog
  • Locations
  • Login
  • Contact Us
Advantage Logo White

Talk to an Advantage expert today

Looking for localized support?

Discover Locations

Seeking a new job opportunity?

Discover Careers

Advantage Logo White

Select the Advantage platform that fits your needs

Require technical support?

Help Desk
advantage-analytics-colour advantage cadence Advantage report
Advantage Logo White
Advantage Group International Logo
  • Our Expertise
    • Our Expertise
    • Strengthening Supplier Partnerships
    • Improving Retailer Relations
    • Increasing Distributor Engagement
    • Boosting Employee Engagement
    • Supporting Sales Teams
  • Engagement Solutions
    • Engagement Solutions
    • Advantage Report
      • A 360° view of your business relationships for improved engagement and performance.
      • How it Works
      • Actioning Feedback
      • Program Benefits
      • Advantage Analytics
      • Refined Framework
    • Advantage Custom Solutions
      • Purpose-built research programs examining your most critical business relationships.
      • Solutions Benefits
      • Feedback Needs
      • Client Testimonials
    • Advisory Services
  • Client Testimonials
  • Insights
  • About Us
    • People
    • Careers
    • Media
  • Blog
  • Locations
  • Login
Contact Us
  • Blog
  • Products

How to Maximize Your Advantage Analytics User Experience in 2021

Published: November 2, 2020

Exploring the Performance Area Details Dashboard

In 2019, Advantage Group International introduced a business intelligence (BI) tool to improve the overall utility and insights capabilities of Advantage ReportTM. A significant revolution in our traditional report delivery, this new digital tool has transformed the experience that users of Advantage Report have been long familiar with. 

Via a series of blog posts, we will provide you with tips and tricks useful for navigating the dashboards within Advantage Analytics with greater ease and agility. In this blog post, we share how to answer your most critical business questions using the Performance Area Details Dashboard. This dashboard is highly useful in drilling down to examine the specific Practices affecting your Performance Area results.

The business questions you are seeking answers to:

  • Where does my performance lie in my competitive set by Performance Area and how has this changed over time?
  • Which Practices are driving my Performance Area results?

Gain insight by following these simple steps:

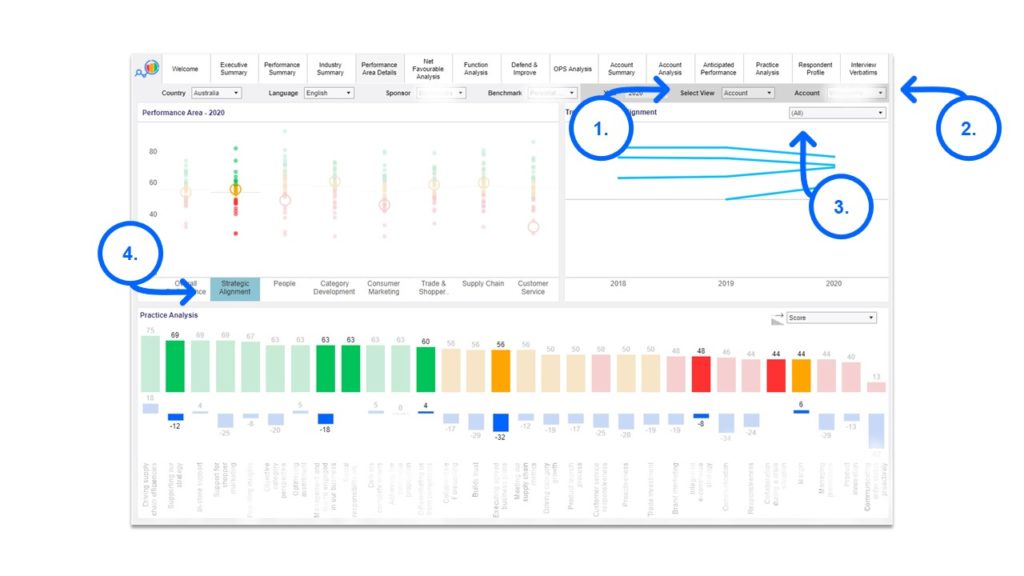
1. Net Favourable Scores by Performance Area

Net Favourable Scores by Performance Area

In the top left corner of the dashboard, view your NF result by Performance Area in your competitive set.

  • The circled marker on the chart indicates your NF result (1).
  • The dashed line in grey shows the Average Net Favourable per Performance Area (2).
  • Hover your cursor over each of the markers to see your competitors’ NF for each Performance Area (3).
  • Use the Year drop-down selection to see NF results by year (4).

2. Trend by Performance Area

Trend-by-Performance-Area

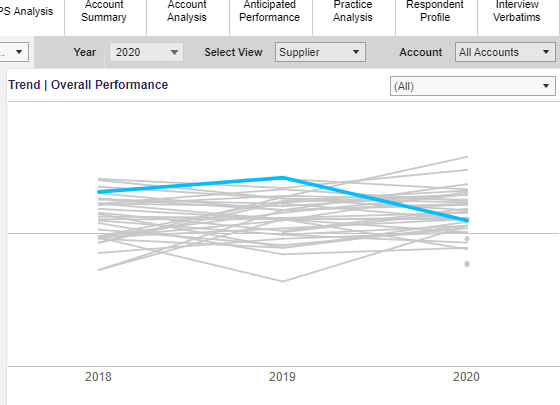
In the top right corner of this dashboard, view trend by Performance Area versus competitors.

The default chart displays trend results versus competitive set for Overall Performance. The blue line is your NF result. The grey lines are competitor results and when you hover your cursor over these grey lines you will reveal the data for these competitor suppliers.

Trend by Performance Area 2
  • To see trend lines per Performance Area, select any of the Performance Area tabs located in the middle of the dashboard (1).
  • This will display all of the Practices that this Performance Area is comprised of across the bottom of the dashboard (2).
  • These individual Practices can be sorted by Score, Rank or Change via the selection box (3).
  • The blue bars at the bottom of the chart show NF score change on the prior year, hover your cursor over these blue bars to view details (4).

3. Performance Area and Practice Analysis by Retail Account

Performance Area and Practice Analysis by Retail Account
  • Change Select View drop-down selection from Supplier to Account (1).
  • Select Retail Account (2).
  • Use this tick box drop-down to select specific retail accounts for comparison on the trend chart (3).
  • You can view performance at an overall level or select any of the Performance Area tabs located in the middle of the dashboard to view by Performance Area and associated Practices (4).

For Additional Technical Support or Troubleshooting, you can access the Advantage Analytics Help Desk here. If you are based in Australia, you may contact Gillian Silvestre directly at gsilvestre@advantagegroup.com or 02 8282 0033.

See Next Related Post: Exploring the Defend and Improve Dashboard


Explore Recent Blogs

View All
Featured Image
  • Community

Women In Conversation – Inspiring Change in the Workplace

August 30, 2023
Featured Image
  • Products

How Advantage Custom Solutions Can Elevate Your Engagement

August 24, 2023
Featured Image
  • Advantage Awards

Tesco Named Partner of Choice by Suppliers in Ireland According to Advantage Report

August 22, 2023

Advantage is devoted to helping your business strengthen engagement through data, insights, and action planning.

Contact Us

Company

  • Locations
  • Careers

Support

  • Help
  • Login
  • Privacy
  • Accessibility
  • Terms of Use
  • Terms of Service

Headquarters

40 University Avenue, Suite 903 Toronto ON M5J 1T1

Subscribe to receive the latest updates

  • Advantage Group Youtube
  • Advantage Group Linkedin
  • Advantage Group Instagram
  • Advantage Group Pinterest

© 2023 Advantage Group International. All Rights Reserved.

Advantage uses cookies to improve the functionality and performance of this site. Do you consent to the use of cookies?

Accept Deny

We are using cookies to give you the best experience on our website.

You can find out more about which cookies we are using or switch them off in .

Advantage Group
Powered by  GDPR Cookie Compliance
Privacy Overview

This website uses cookies so that we can provide you with the best user experience possible. Cookie information is stored in your browser and performs functions such as recognising you when you return to our website and helping our team to understand which sections of the website you find most interesting and useful.

Strictly Necessary Cookies

Strictly Necessary Cookie should be enabled at all times so that we can save your preferences for cookie settings.

If you disable this cookie, we will not be able to save your preferences. This means that every time you visit this website you will need to enable or disable cookies again.

3rd Party Cookies

This website uses Google Analytics to collect anonymous information such as the number of visitors to the site, and the most popular pages.

Keeping this cookie enabled helps us to improve our website.

Please enable Strictly Necessary Cookies first so that we can save your preferences!